At Issue D.C. - The Costs of Providing Housing Are Going Up
JANUARY 2022 EDITION
The Costs of Providing Housing Are Going Up
A glance at the paper makes it clear, the costs of providing rental housing are skyrocketing across the country. The implications for the District – already starved for housing across the affordability spectrum – are considerable and compounding.
Soaring Operational and Building Costs
Approximately 91% of rent collected goes directly to the cost of maintaining, managing and operating the property and funding the local jurisdiction via real estate taxes. The list is long: mortgage payments and interest, payroll for people who live and work in our towns and cities, utilities, business licenses and other taxes, hazard and liability insurance, in-apartment routine repair and maintenance, contract services like waste collection, janitorial services, maintenance of mechanical systems, boilers, air conditioning systems and elevators, and fire suppression systems. This is not to mention replacement reserves for major repairs to windows, masonry, roofs, elevators, plumbing, electrical and HVAC. All of these line items have been growing at a pace beyond inflation for a decade and have experienced significant increases over the last year, in part due to COVID-19. These costs are projected to continue to rise as our economy struggles to regain its footing amid supply and labor shortages, which only compound the problem.
The folks who provide housing to our communities rely on rent as their singular revenue source. Unlike other types of businesses, housing providers do not have the ability to balance losses with other revenue categories. This is compounded in rent-controlled jurisdictions where rents do not keep pace with expenses. Unexpected cost increases (and rent losses for that matter) may only be managed through an increase in rent, a reduction in services to residents, or a deferral of planned capital investments.
AOBA members, large and small, cite skyrocketing fixed costs, including:
- DC Water annual increase of 7.5% effective October 1.
- Rising electric rates have driven up electricity costs. The Public Service Commission of the District of Columbia approved a three-part base distribution electric rate increase for PEPCO customers over 18 months: 5.5% beginning July 1, 2021, 17.6% effective January 1, 2022, accumulating to a 27.2% increase effective January 1, 2023.
- The impact to members is often substantially higher due to the way rates are determined and applied to commercial accounts.
- Additionally, commodity costs for both natural gas and electric supply have risen significantly in the past year directly impacting the costs for building and operating multi-family housing.
- The cost of natural gas is a significant driver of electricity prices because it often acts as the marginal (highest cost) fuel of generating units that operators dispatch to supply electricity. Natural gas prices trended higher over the last year. The delivered cost of natural gas to electricity generators grew from $3.19/MMBtu in January 2021 to an estimated $5.04/MMBtu in the fourth quarter of 2021 which represents a >50% increase.
- Building operators received approximately an 11%-13% increase in their Gas distribution costs effective April 1, 2021.
- Minimum wage increases and DC Paid Leave tax.
- Insurance (up 20% in each of the last two years).
- Tax increases, including transfer and recordation taxes, which are passed on to renters, including individuals and small “mom and pop” retailers.
Bisnow recently explored the direct relationship between inflation and rent growth in their December 20, 2021 article “The Race is on Between Multifamily Rental Increases and Inflation.” Here are a few selected highlights:
- There is no indication that costs will fall in the future, due primarily to continued supply chain disruptions. Demand for key commodities is forecasted to continue to exceed supply.
- For residential projects, construction input prices rose 23.5% in November compared with a year ago.
- Energy costs were an important driver of this increase, with natural gas prices up 150.6% for the year and crude oil up 115.2%.
- Building material prices also rose, with iron and steel up 105.1%.
- Shortages of some items – such as refrigerators and other appliances – can potentially delay the opening of a property, leading to lost rental income.
- Labor costs are also on the rise
- Hourly wages are up 4.8% in November compared with last year. This is consistent across all private industries.
- The number of residential building projects under development has risen to meet demand, requiring an increase in the number of workers to implement them. The overall increase in the labor force is 6.2% year over year.
- Construction costs affect existing properties as well, with housing providers required to spend substantially more for any significant improvements.
- Premiums have increased substantially across all lines of insurance
- According to NDP analytics in a May 2021 survey for the Institute for Real Estate Management, National Apartment Association, and other sponsors:
- Overall, per unit insurance costs are up nearly 19%.
- 60% of survey respondents reported increases of more than 15% over the previous year for umbrella/excess liability insurance.
- 1 in 10 housing providers saw their premiums double.
- According to NDP analytics in a May 2021 survey for the Institute for Real Estate Management, National Apartment Association, and other sponsors:
In the District, tenants have been insulated from the impacts of inflation. A legislative freeze on rent increases during the COVID-19 pandemic has artificially suppressed rent levels. Moving forward, rent growth is further restricted by the District’s Rental Housing Act. Based on the Consumer Price Index of 1% recently announced by the Rental Housing Commission, rent increases will be capped at a maximum of 3% for rent-controlled properties and 1% for elderly/disabled tenants. But the broader trend certainly has reverberating impacts for tenants and housing providers alike.
What is the Continued Viability of Naturally Occurring
Affordable Rental Housing?
Inflation and soaring operating costs are driving increased rents across the region and nationally. Insufficient supply of housing further contributes to rent pressure. (The District of Columbia needs to build approximately 1,000 new apartment homes each year to meet projected demand). The skyrocketing costs of operating rental housing combined with regulatory uncertainty and legislative limitations on revenues depresses new investment by the global equity market in housing production. With no immediate relief forecasted on the horizon for most of these factors, housing affordability will continue to challenge the region and the industry over the long-term.
D.C. Commercial Office Market Snapshot
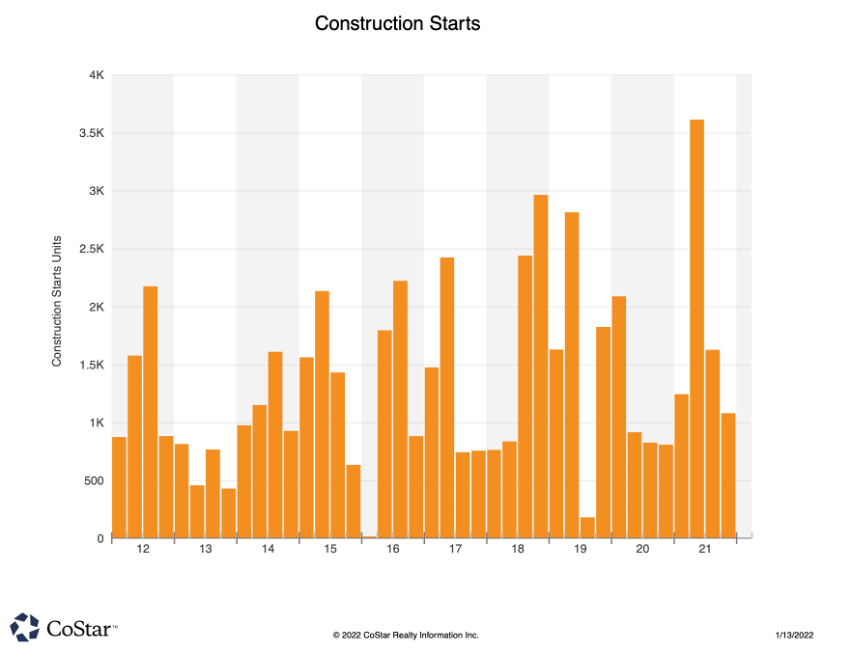
Provided below are key performance indicators for the D.C. commercial office market. Notably, vacancy rates have spiked to about 14.5%. This will likely contribute to lower assessed values, suppressing local real estate tax collections in the upcoming fiscal year. This shifts the tax burden onto residential taxpayers. Not surprisingly, new construction starts for commercial office properties are also on the decline given the glut of available office space.
 |
 |

D.C. Multifamily Market Snapshot
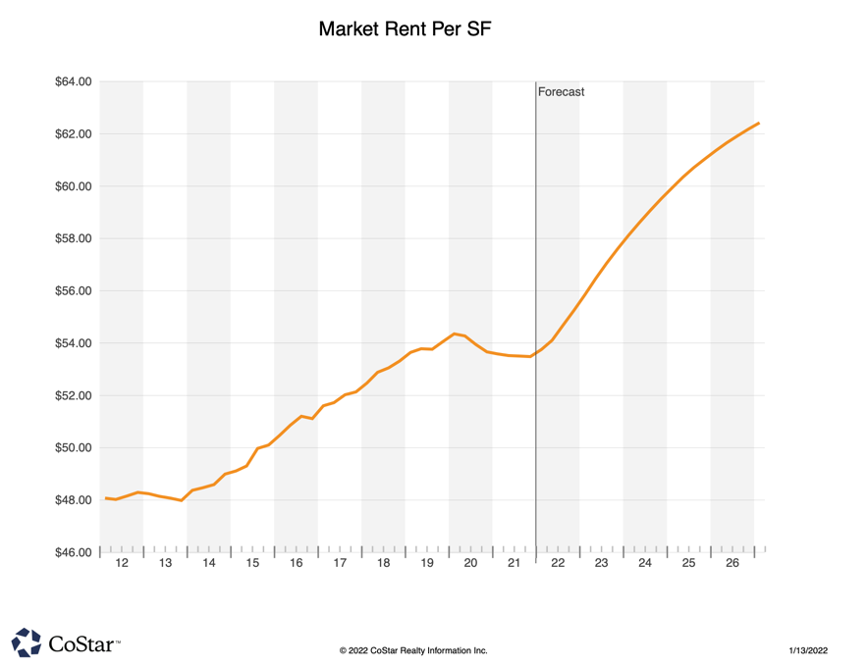
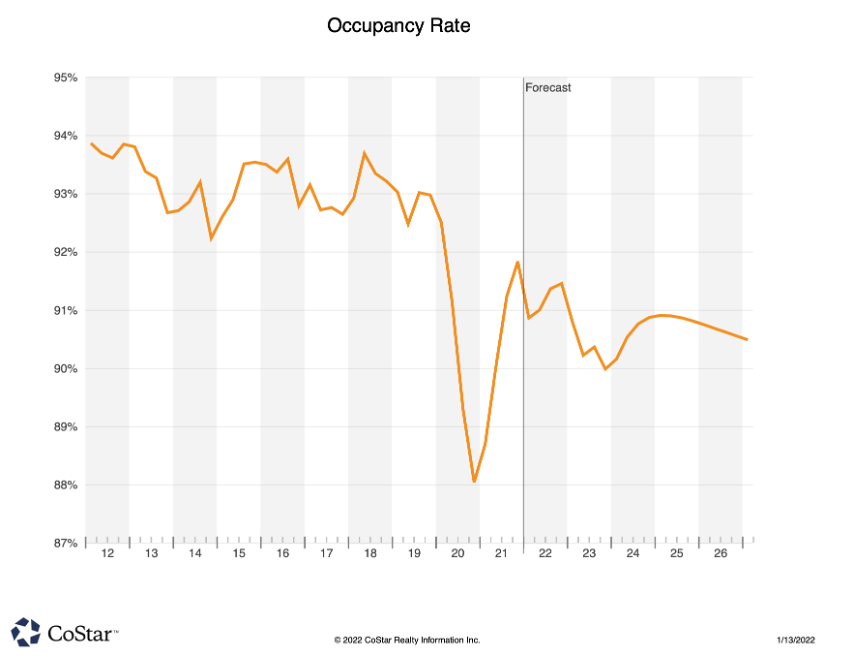
Provided below are key performance indicators for the D.C. multifamily residential market. Notably, rents have remained relatively flat, in contrast with soaring inflation as described above. Meanwhile, occupancy rates have recovered after taking a significant dip during the early part of the COVID-19 pandemic, but are projected to decline moving forward.

 |
 |

At Issue is compiled by the Apartment and Office Building Association (AOBA) of Metropolitan Washington, and is intended to help inform our elected decision-makers regarding the issues and policies impacting the commercial and multifamily real estate industry.
AOBA is a non-profit trade organization representing the owners and managers of approximately 172 million square feet of office space and over 400,000 apartment units in the Washington metropolitan area. Of that portfolio, approximately 80 million square feet of commercial office space and 94,000 multifamily residential units are located in the District. Also represented by AOBA are over 200 companies that provide products and services to the real estate industry. AOBA is the local federated chapter of the Building Owners and Managers Association (BOMA) International and the National Apartment Association.
Along with input provided by AOBA member companies, the following data sources and references were used in compiling the attached report:
- Dees Stribling. “The Race is on Between Multifamily Rental Increases and Inflation.” Bisnow National, December 20, 2021.
- CoStar Commercial Real Estate Data, Information and Analytics Service.
- National Apartment Association, “Explaining the Breakdown of $1 of Rent.” YouTube, April 9, 2020.
- National Apartment Association’s 2021 Survey of Operating Income & Expenses in Rental Apartment Communities.
- National Apartment Association’s COVID-19 Survey Results.
- “Monthly Construction Input Prices Continue to Climb in November.” Associated Building Contractors, December 14, 2021.
- “Nonresidential Construction Employment Rises in November, Says ABC.” Associated Building Contractors, December 3, 2021.
- “Increased Insurance Costs for Housing Providers; Survey Findings on the Magnitude, Rationale, and Impact of Increased Insurance Premiums on Affordable and Conventional Housing Providers.” Institute of Real Estate Management, May 2021.
- “Wholesale Electricity Prices Trended Higher in 2021 Due to Increasing Natural Gas Prices.” January 7, 2022. U.S. Energy Information Administration.
AOBA strives to be an informational resource to our public sector partners. We welcome your inquiries and feedback. For more information, please contact our Senior Vice President of Government Affairs, Brian Gordon.
